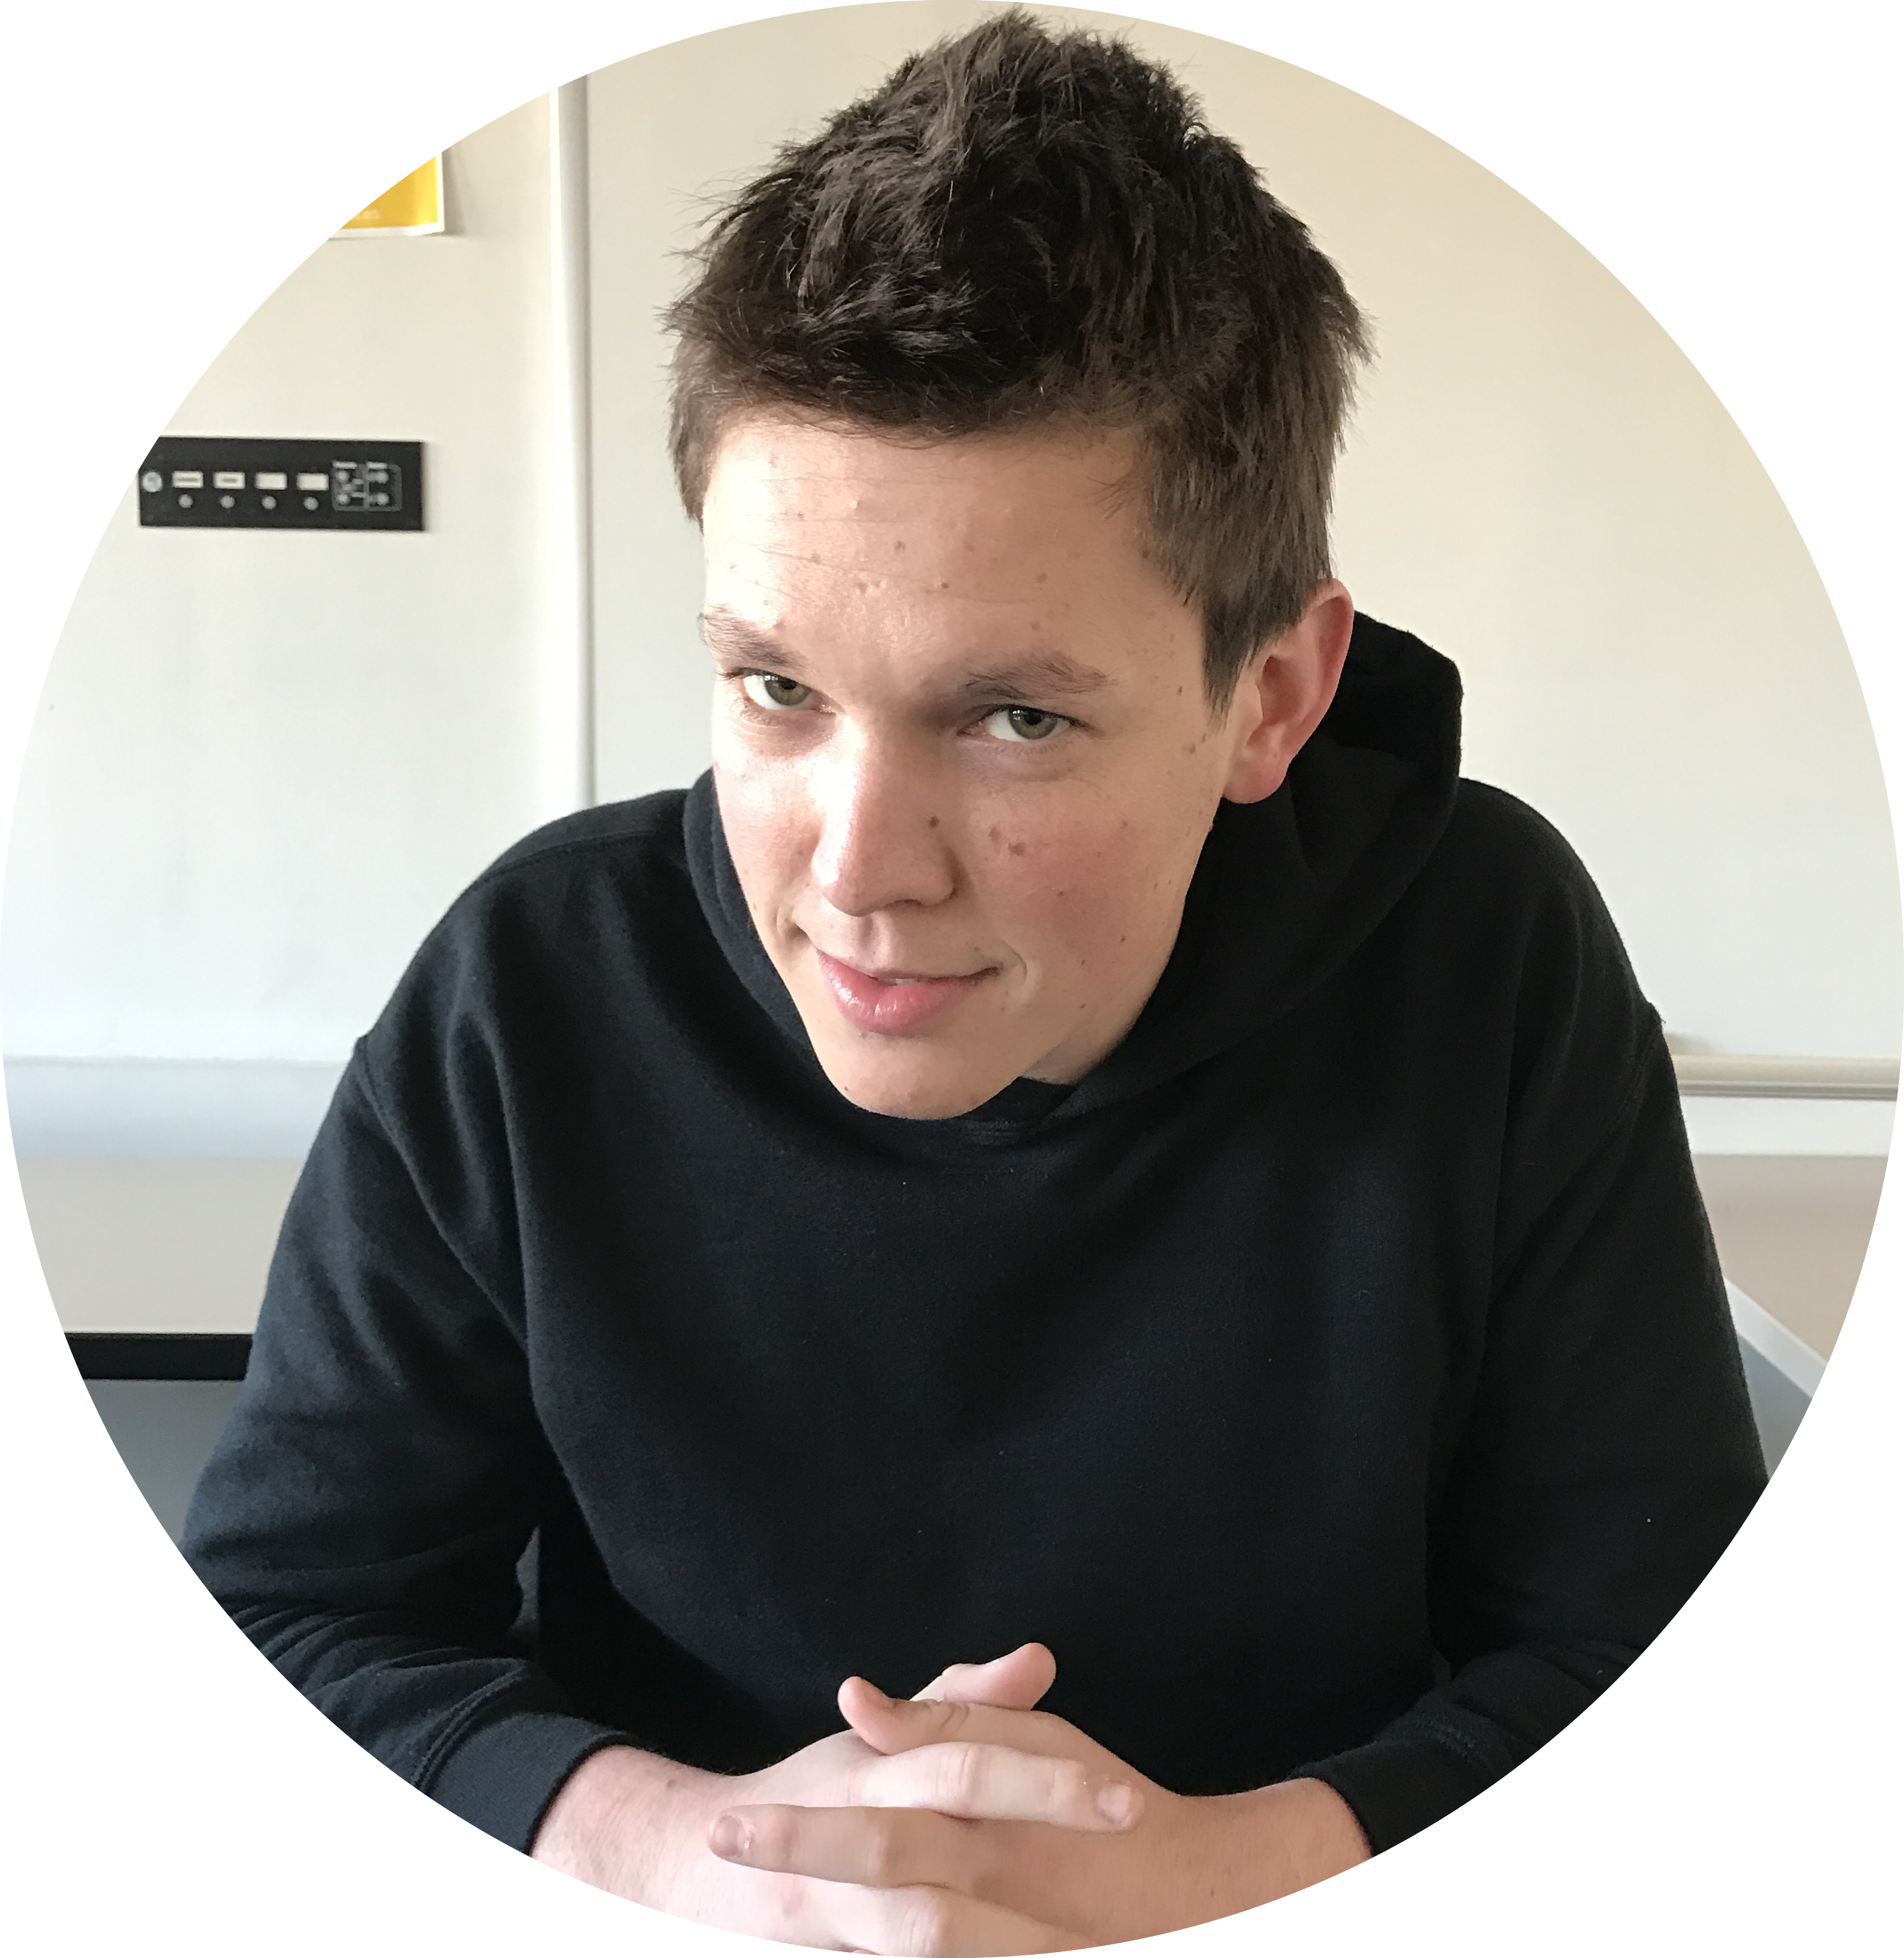
Team Members

| Denali Marsh
Major: Computer Science Hometown: Sacramento, CA Expected Graduation: December 2017 Likes: Swimming, Socializing, Long walks on the beach |
 |
Kaishvi Parikh
Major: Finance | Minor: Computer Science Hometown: San Jose, CA Expected Graduation: May 2018 Likes: Dance, Travel, Disney |

| Kanika Priyadarshi
Major: Finance | Minor: Computer Science Hometown: Fremont, CA Expected Graduation: May 2018 Likes: Martial Arts, Thai Food, Arts&Crafts |
 |
Saman Dalo
Major: Computer Science Hometown: San Mateo, CA Expected Graduation: May 2018 Likes: Food, Basketball, Music |
Team Tasks
In order to start off the project, we split off responsibilities on prototyping. Kaishvi worked on the data and creating the prototype for the pie chart, Kanika worked on the stacked area chart, Denali worked on both stacked bar charts, and Sam worked on the heat map. After prototyping, we realized that we had a few changes to make on the visualizations. This included parsing the legend data differently to show important information. We all worked together to find the most important data to use to make d3 versions for. Mainly, Kaishvi implemented the pie chart and legend, Kanika implemented the stacked area chart and battalion stacked bar chart, Denali implemented neighborhood stacked bar chart, and Sam implemented the heat map and line chart in d3. After all of these were done on individual levels, Kaishvi and Kanika designed the professional formatting, and we all made sure that the svgs are consistently formatted on their respective pages and that the analyses were thorough.