| Title | About | Interesting Finding |
|---|---|---|
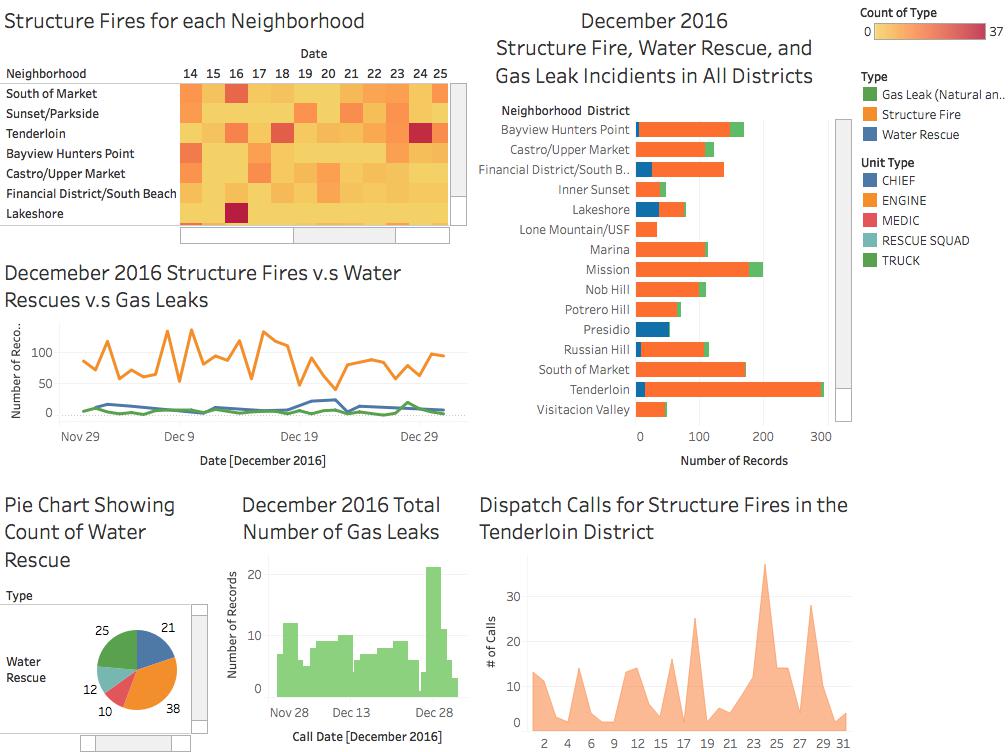
| Structure Fires for each Neighboorhood |
The heatmap gives us an idea about which days had the most calls pertaining to each neighboorhood. The graph displays each day in Decemeber 2016. The lighter colors represent little to no calls and the dark reds represent the highest amount of calls. | Both Lakeshore and Tenderloin had a lot of incoming calls during a span of one day, but Lakeshore is the district with the most amount of calls in one day. |
| Structure Fires vs Water Rescue vs Gas Leaks |
The trend of total number of incidents for structure fire, gas leak, and water rescue. Each color represents one of the three data types. | This graph shows the high and low spikes of fire incidents compared to the low amount of water rescues and gas leaks. |
| Structure Fires, Water Rescue, Gas Leaks Incidents in all Districts |
The graph is based on the amount of gas leaks, structure fires, and water rescues categorized in each neighborhood district of San Francisco. The bars show us total number of records for each Neighborhood District that experienced at least one of these incidents. The color displays details based on the type of incidient, which helps a viewer understand which call type occured most. | From this graph, one can conclude that structure fires are more common in all the districts compared to gas leaks and water rescues. In addition, the graph also illustrates to us that structure fire is the highest in the Tenderloin district. |
| Pie Chart Showing Count of Water Rescue |
The graph shows what unit type was called for all the water rescues during the month of December 2016. The colors identify with the different unit type, like chief or medic. | One can conclude from the graph that an engine and a truck always show up but the rescue squad was only needed in severe cases and a medic was needed far less times. |
| Total Number of Gas Leaks | Total Number of Records of Gas Leaks During December 2016 in San Franisco. | There are higher amounts of gas leaks during christmas week. |
| Dispatch Calls for Structure Fires in Tenderloin |
The area graph shows the number of calls made for a structure fire in the Tenderloin district across the whole month of December 2016. We focus on the Tendorloin because it had the most calls for a structure fire during this month than any other district. We can see that that number of calls increases and decreases through out the month. There is no point during the month when the number of fires becomes zero. | There are three sepereate days where the number of calls grew above 20. The particular day that is interesting is the 24th which is Christmas eve. Potentially, there was a big fire on that particular day which attracted much attention. |