-

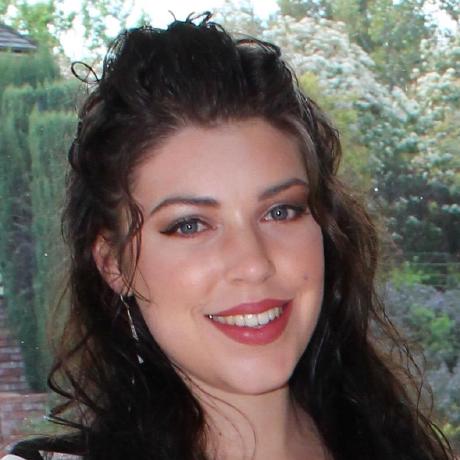
Monica Metzger
I attend the University of San Francisco. I am in the process of earning my undergraduate degree in Computer Science.I will be graduating in May of 2017. I have 6 rescue animals. I love spending time with my family and my animals.
For this project, I specifically worked with the gas leak data. I created tableau prototypes for the multi-line chart, the horizontal bar chart, and the vertical bar chart. I created the d3 version of the multi-line gragh and the gas leak area chart. In addition, I helped put together the website. Specifically on the Data page and About the Queens page.
-

Marilyn Cruz
I attend the University of San Francisco, currently working towards by bachelors degree in computer science. I'm expected to graduate Spring 2018! When I'm not busy writing code, I love to dance, read, go on adventures, and watch movies all day.
I worked on bringing together the prototypes in one dashboard and adding them to the website. For the site, I managed the prototype page by adding the prototypes and adding the descriptions. I also worked on describing the subset of data we used. For our visualizations, I focused on the fire element and prototyped the heatmap and the area graph. I created the heatmap and fire area graph in d3 and helped format the website as well!
-

Nyssa Chennubhotla
I am currently a student at the University of San Francisco studying Computer Science. I grew up in San Ramon, California. My role models are Sheryl Sandberg and my mom. It is hard for me to pick a favorite color but I like pastel pink in particular. I enjoy drinking coffee with splenda and half and half, please don't judge.
For this project, I created a unique data set for our project that focused on the elements of earth(wind, water, and fire). In addition, I designed, created and formatted our professional website! My focus of the data set was water rescue, hence I prototyped the pie chart and created its d3 version.