Project Description
This project explores San Francisco housing issue and trying to figure out how the affordable housing help people to stay in the city.
The Dataset Description
The dataset I used for this project is called "Affordable_Housing_Pipeline" from SFOpenData. The original data was provided by Mayor's Office of Housing and Community Development.According to the Public Domain Dedication and License, I am allowed to “freely share, modify, and use this work for any purpose and without any restrictions.” SFOpenData describes this dataset as a "snapshot of the Mayor’s Office of Housing and Community Development (MOHCD) and the Office of Community Investment and Infrastructure (OCII) affordable housing pipeline projects. The projects listed are in the process of development--or are anticipated to be developed--in partnership with non-profit or for-profit developers and financed through city funding agreements, ground leases, disposition and participation agreements and conduit bond financing. The Affordable Housing Pipeline also includes housing units produced by private developers through the Inclusionary Affordable Housing Program".
Motivation
When I was finishing my freshmen year at USF, I had to look for an off-campus housing. At the time, I wasn’t aware of how expensive and competitive the housing market in San Francisco is, so I started very late and didn’t get the best deal. This experience motivated me to look deeper into the housing crisis in San Francisco and try understanding what’s causing it, and one of the main issues I’ve discovered was the lack of affordable housing. The “Affordable Housing Pipeline” data allowed me to further analyze, whether the affordable housing plan provided enough housing to eliminate the shortage and fix the housing crisis in San Francisco.
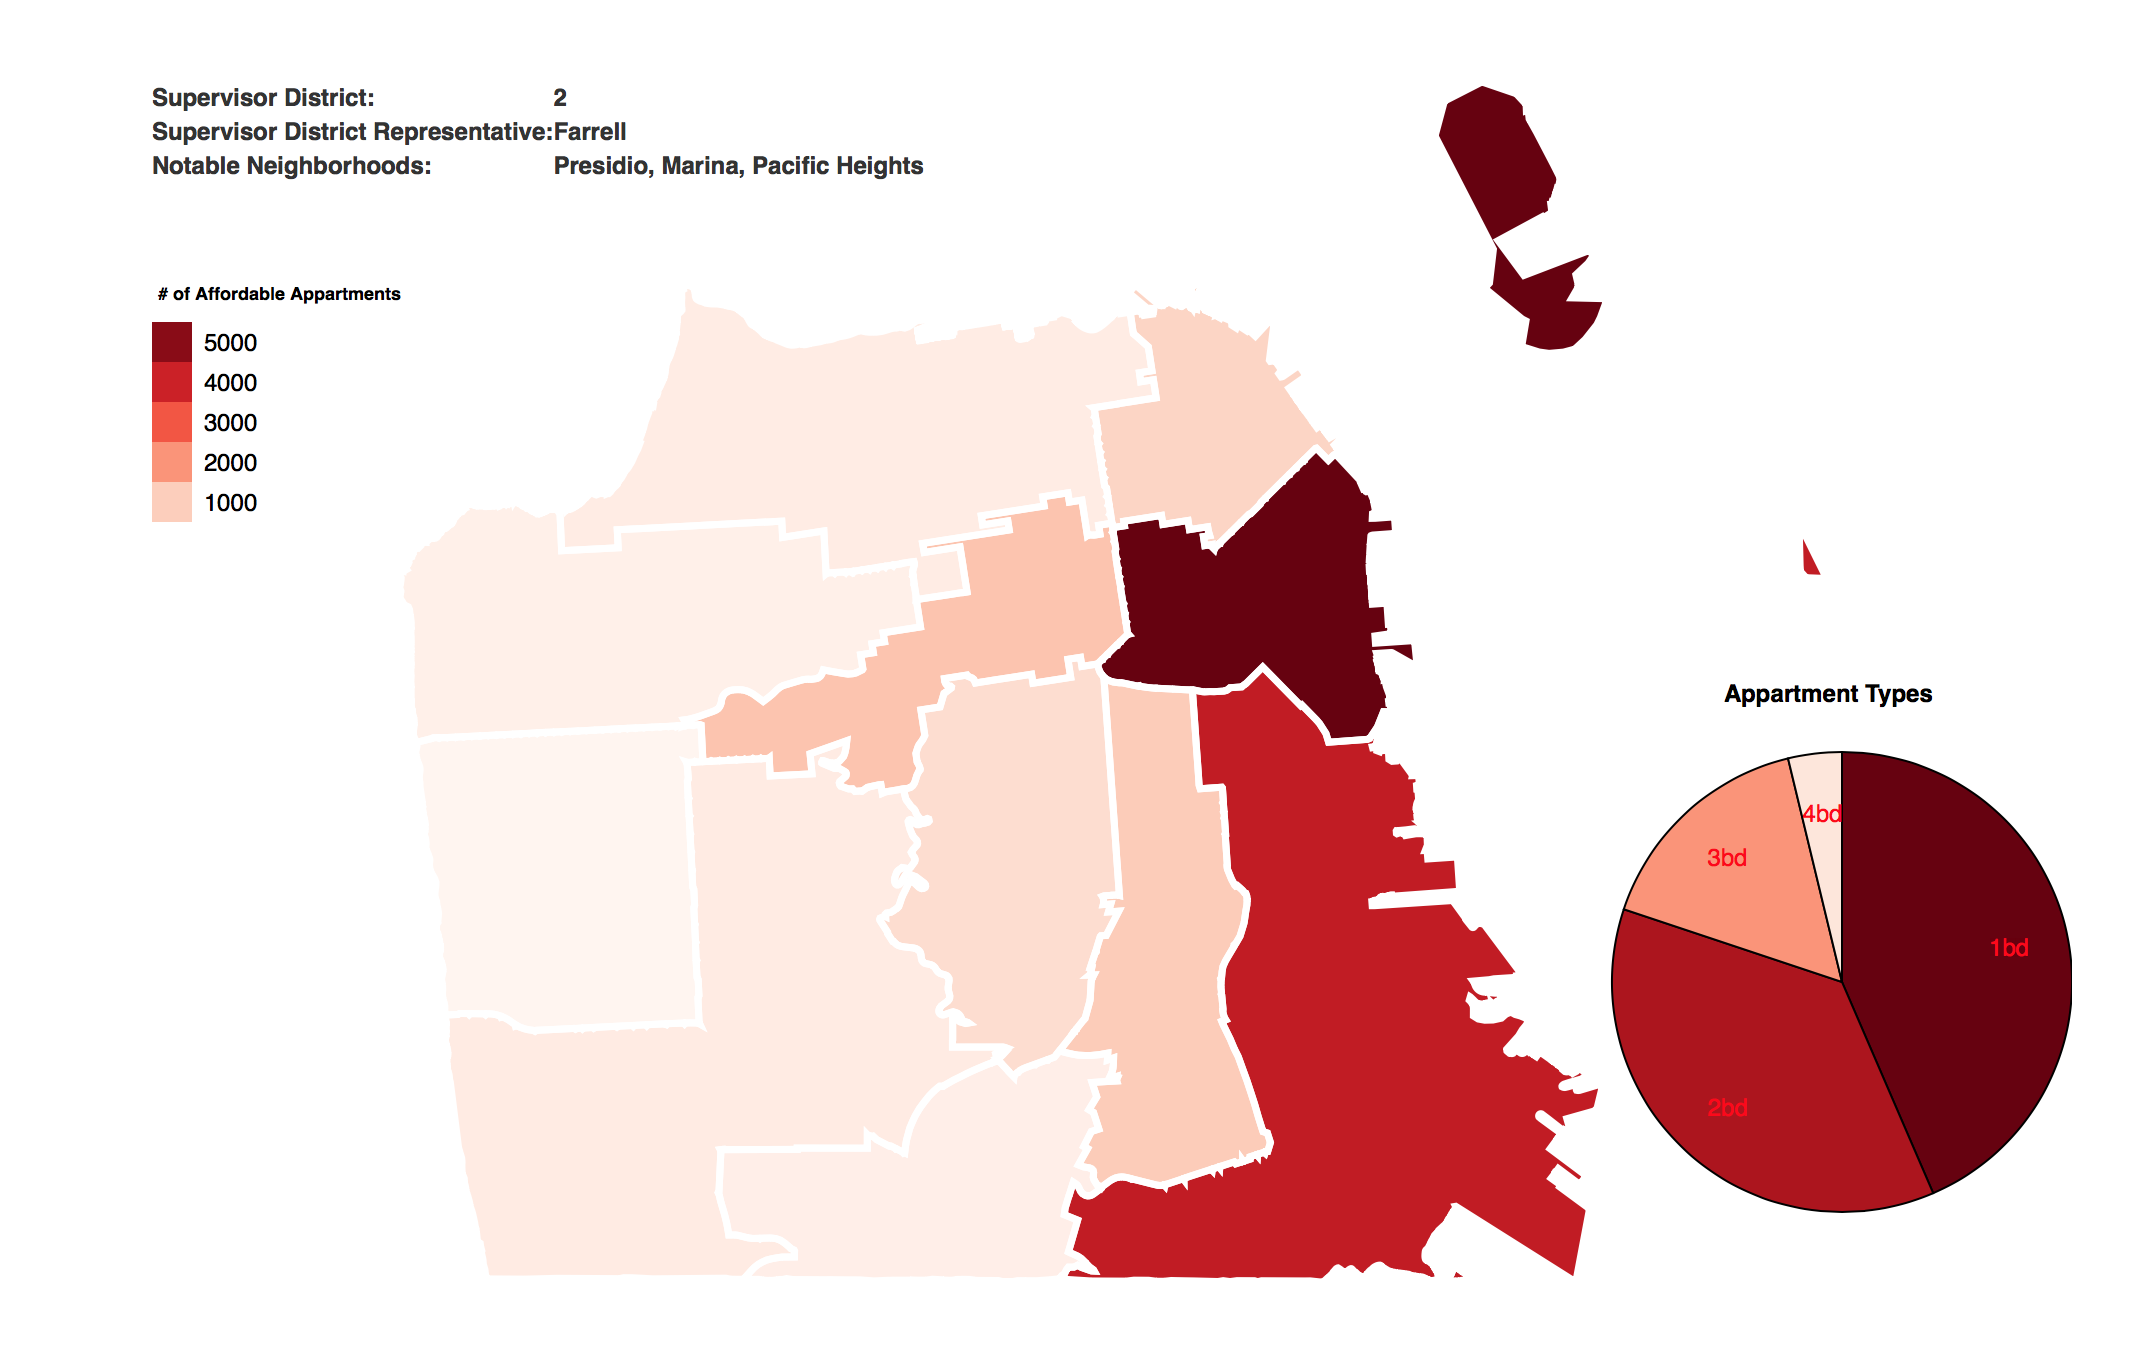
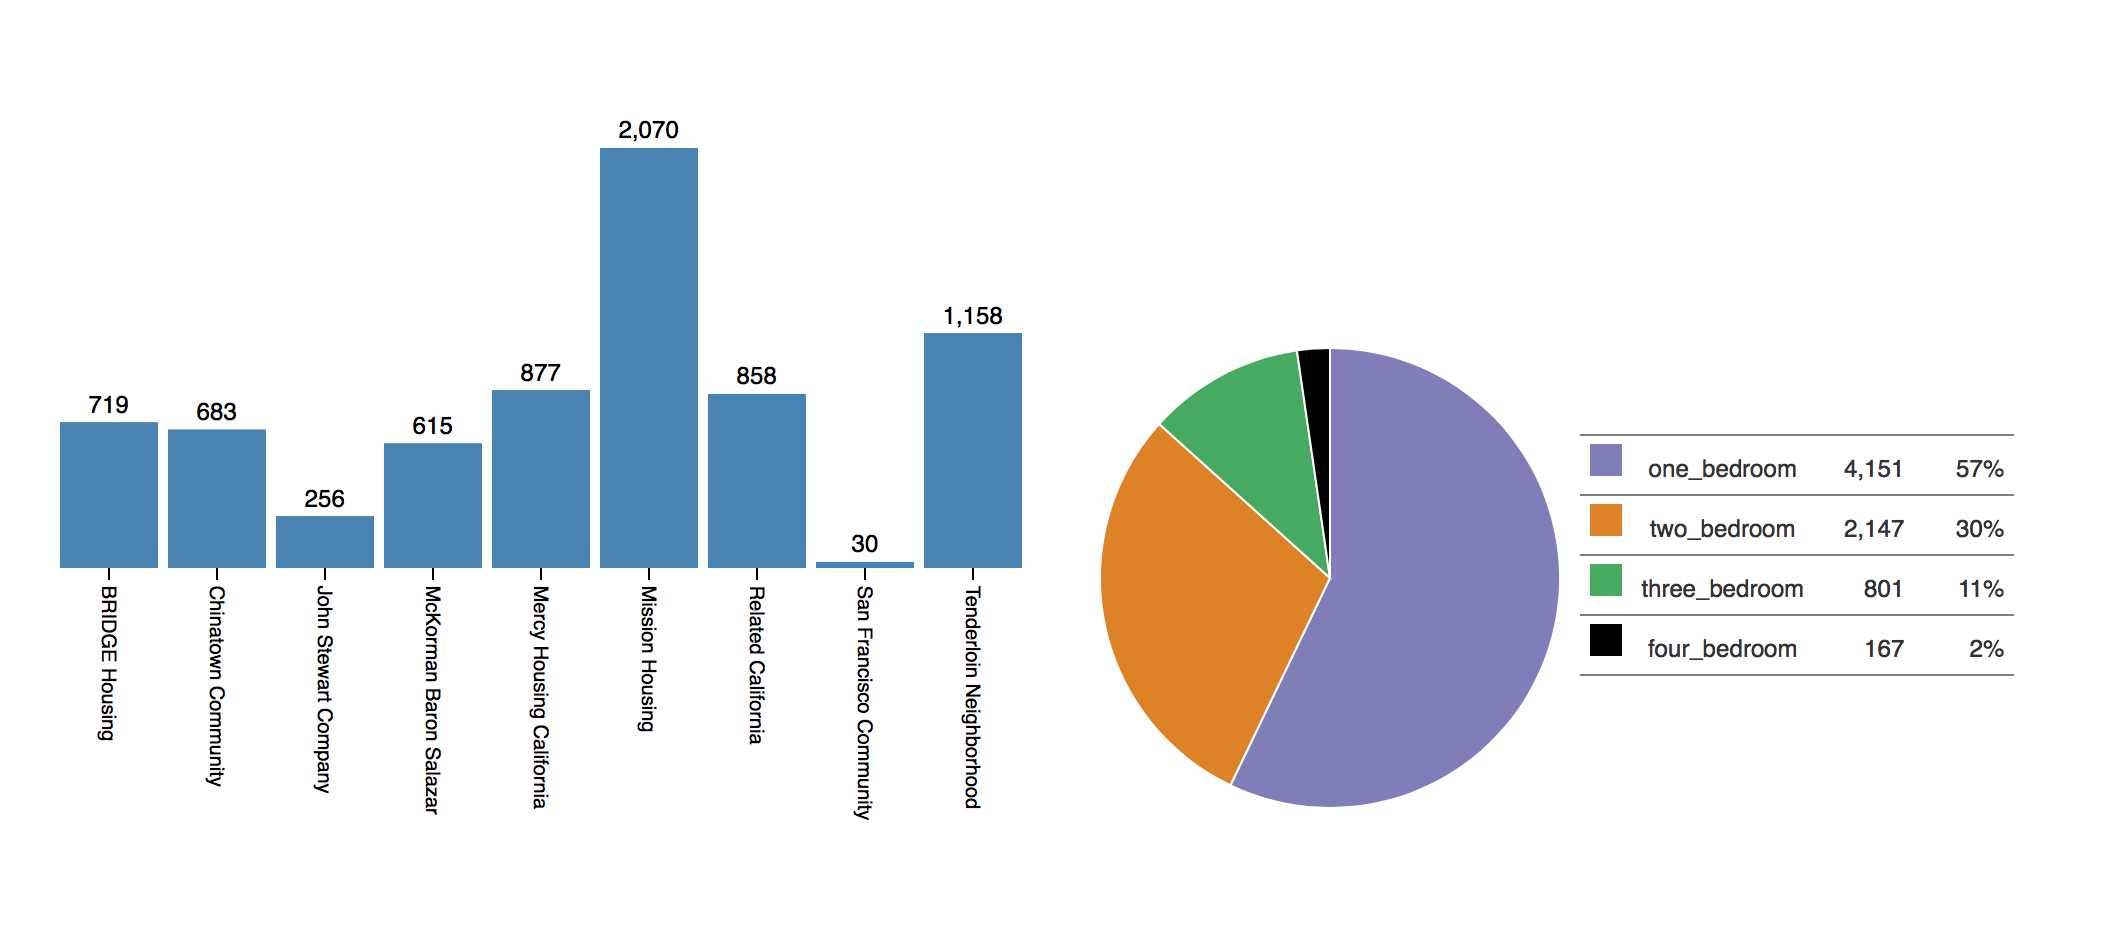
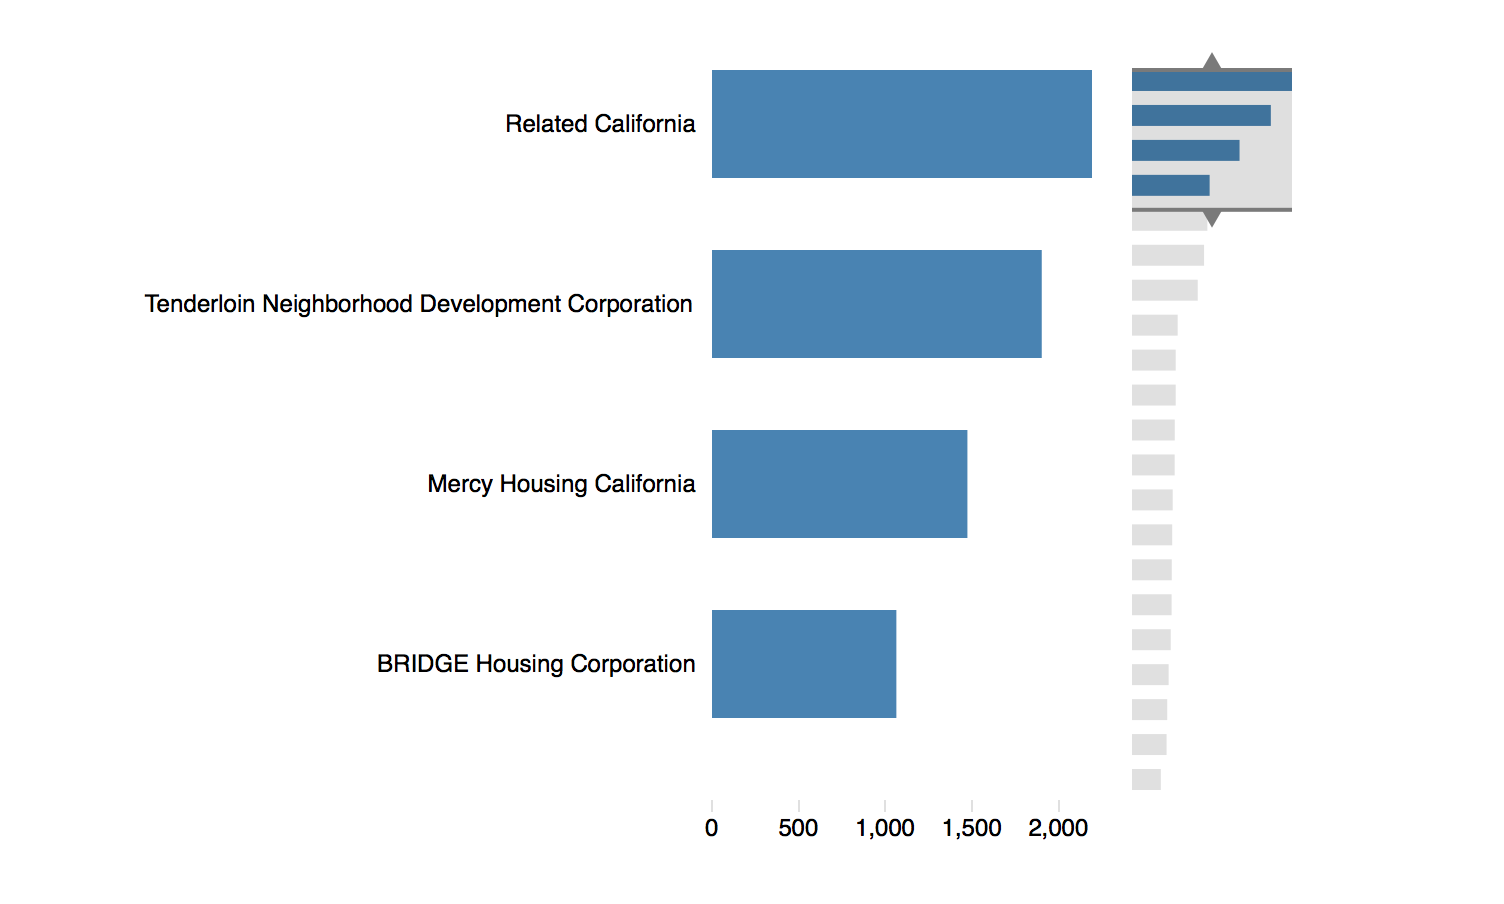
The thing I wanted to learn from this project is if the housing situation will be improved in 2019 (the plan ends in 2018). I wanted to see how many planned projects will be completed (some of them don’t have the completion date at all, so they don’t count) by December 31, 2018; more specifically, how many new affordable units will be on the housing market at the beginning of 2019. I’m also interested in how the government is distributing the housing across all of the city’s areas; what neighborhoods in San Francisco are anticipated to get the most affordable housing. I'm also excited to know what companies support the affordable housing development, and who contributes the most out of them. Overall, my general goal is to understand whether this plan (assuming all of the projects are successful) can successfully eliminate the lack of affordable housing in the city.
Data Processing
This project involved a lot of data processing, since not all the data was directly stored in an aforementioned dataset. I mostly used d3 tools (e.g "d3.nest") to process the data; however, sometimes I had to manually put the values in a separate csv, since it was the most optimal solution for the data provided. The detailed description of the data processing is attached to every individual visualization.
Findings
Unfortunately, I couldn't find the way to answer the main question, whether the housing problem will be solved by 2018, since the dataset doesn't contain enough data to sucessfully answer it. However, the city is making a progress and trying its best to solve it. However, I discovered that the housing destribution among the districts is fair, and what district gets the most housing. The more detailed results are available under every indvidual visualization
Visualizations (click to explore)