Prototypes
Description
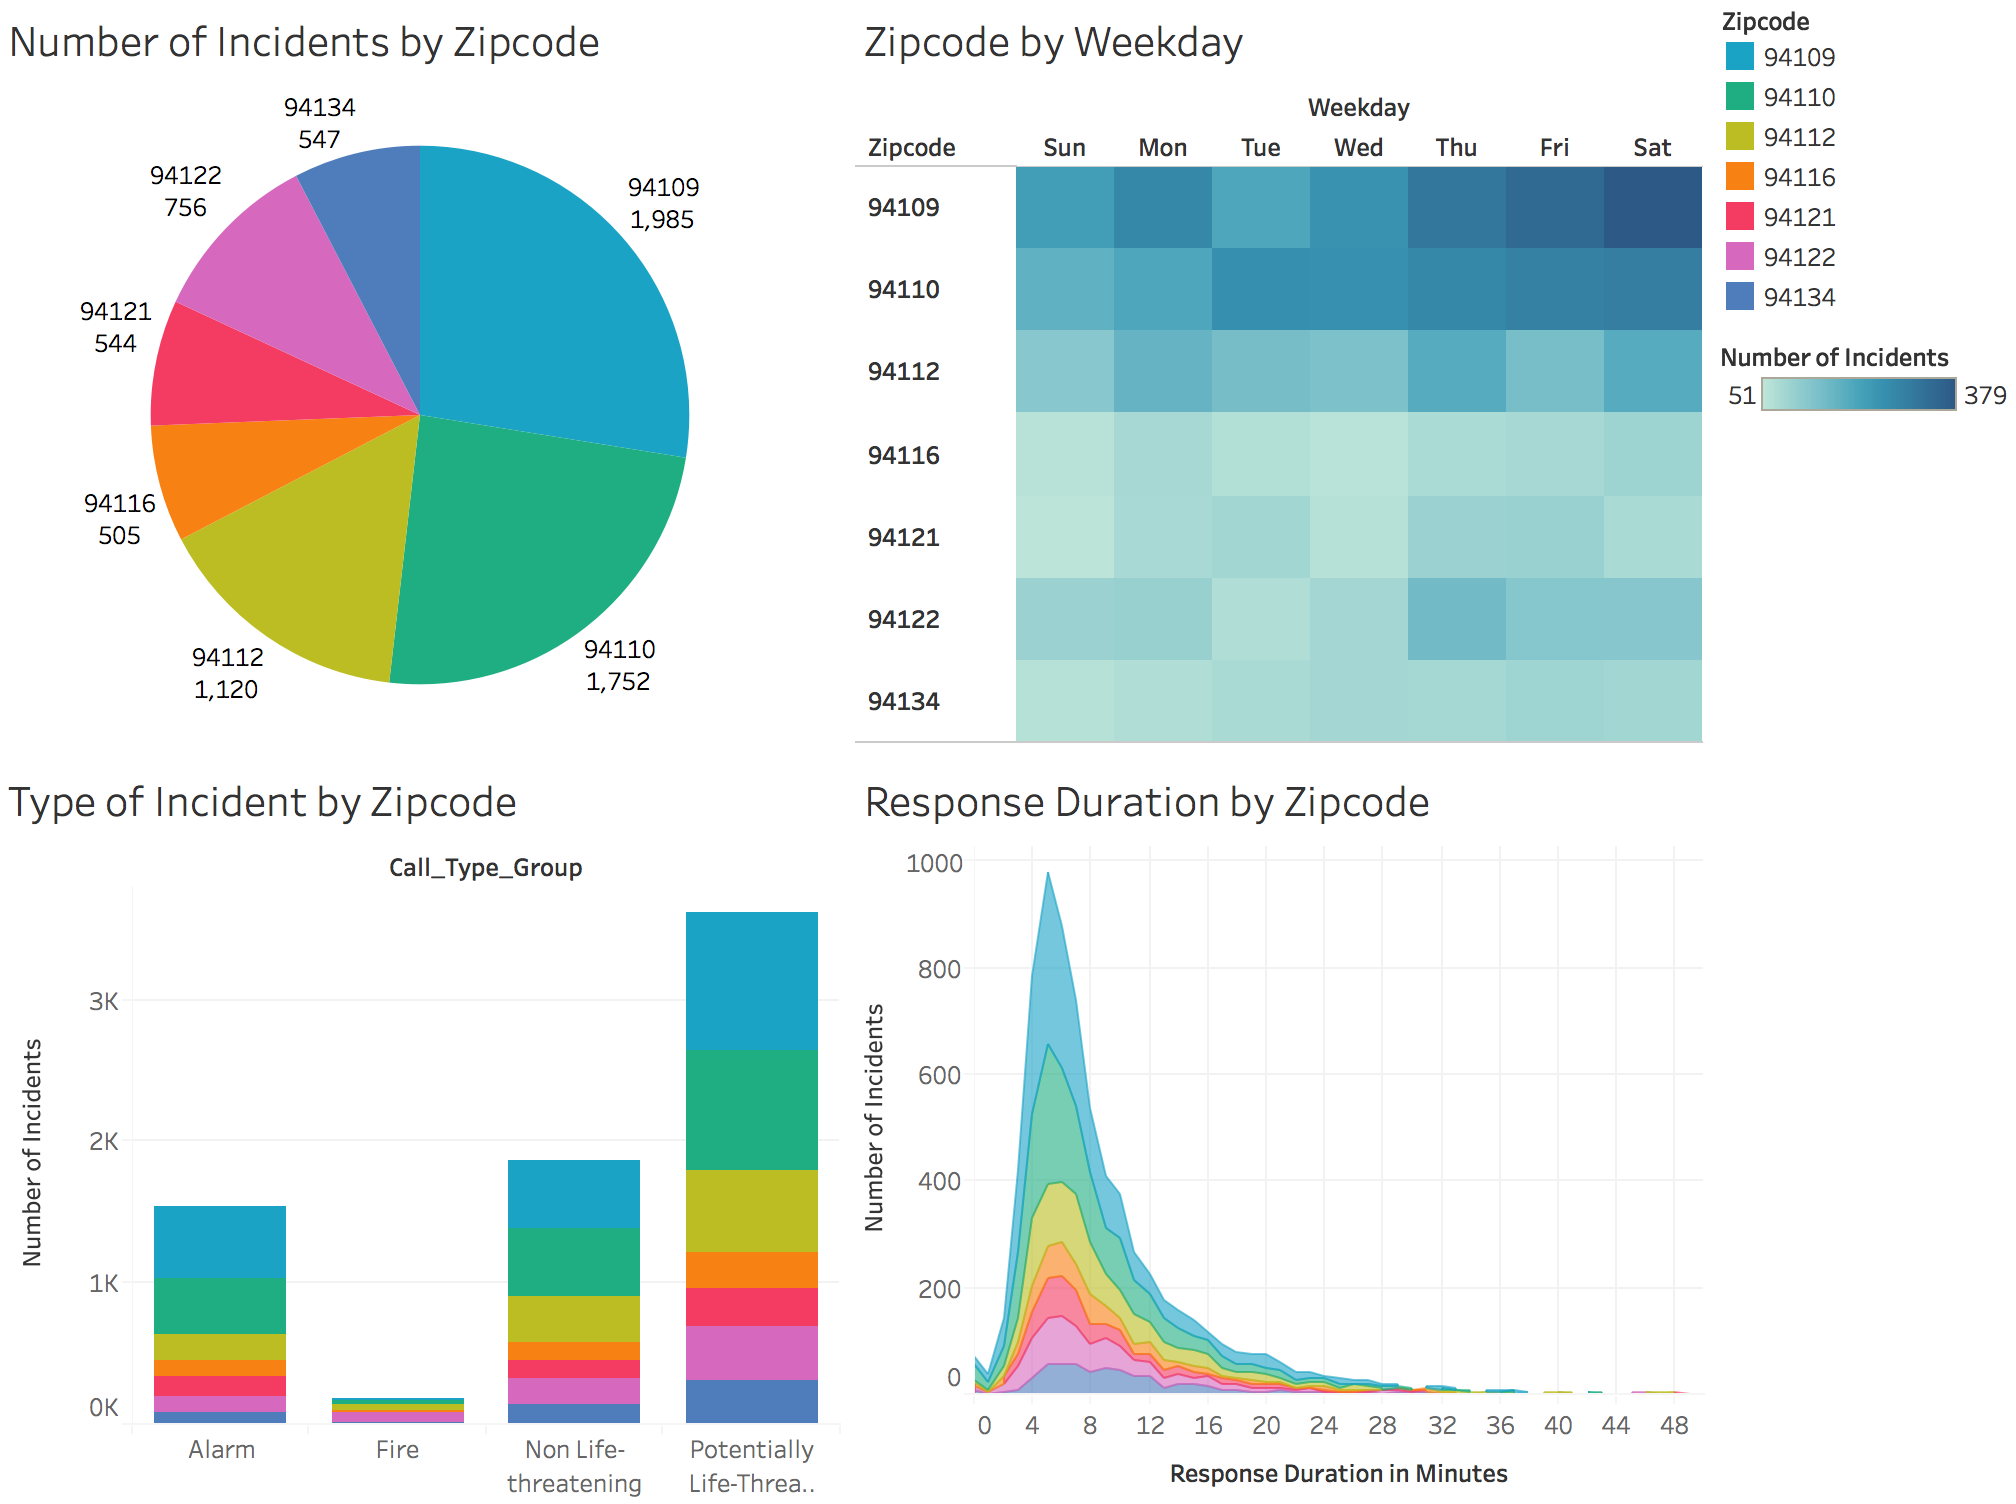
The four visualizations our team creates shows the information about the number of incidents, the type of happened incidents, the frequency of incidents happened and response time of happened incidents in different neighborhoods. Since there are too many neighborhoods for pie chart and stacked charts to encode, we want to select seven most populated neighborhoods. Since zip code is labelled better in pie chart than neighborhood does, we change the neighborhoods to zip code in our visualization. Here 94109 represents the Nob Hill neighborhood, 94110 represents the Mission neighborhood, 94112 represents Excelsior neighborhood, 94116 represents Parkside/Forest Hill neighborhood, 94121 represents Outer Richmond neighborhood, 94122 represents Sunset neighborhood, and lastly 94134 represents Visitacion Valley neighborhood. One thing we think very interesting is that fire related incidents actually happened much less than other types of incidents.